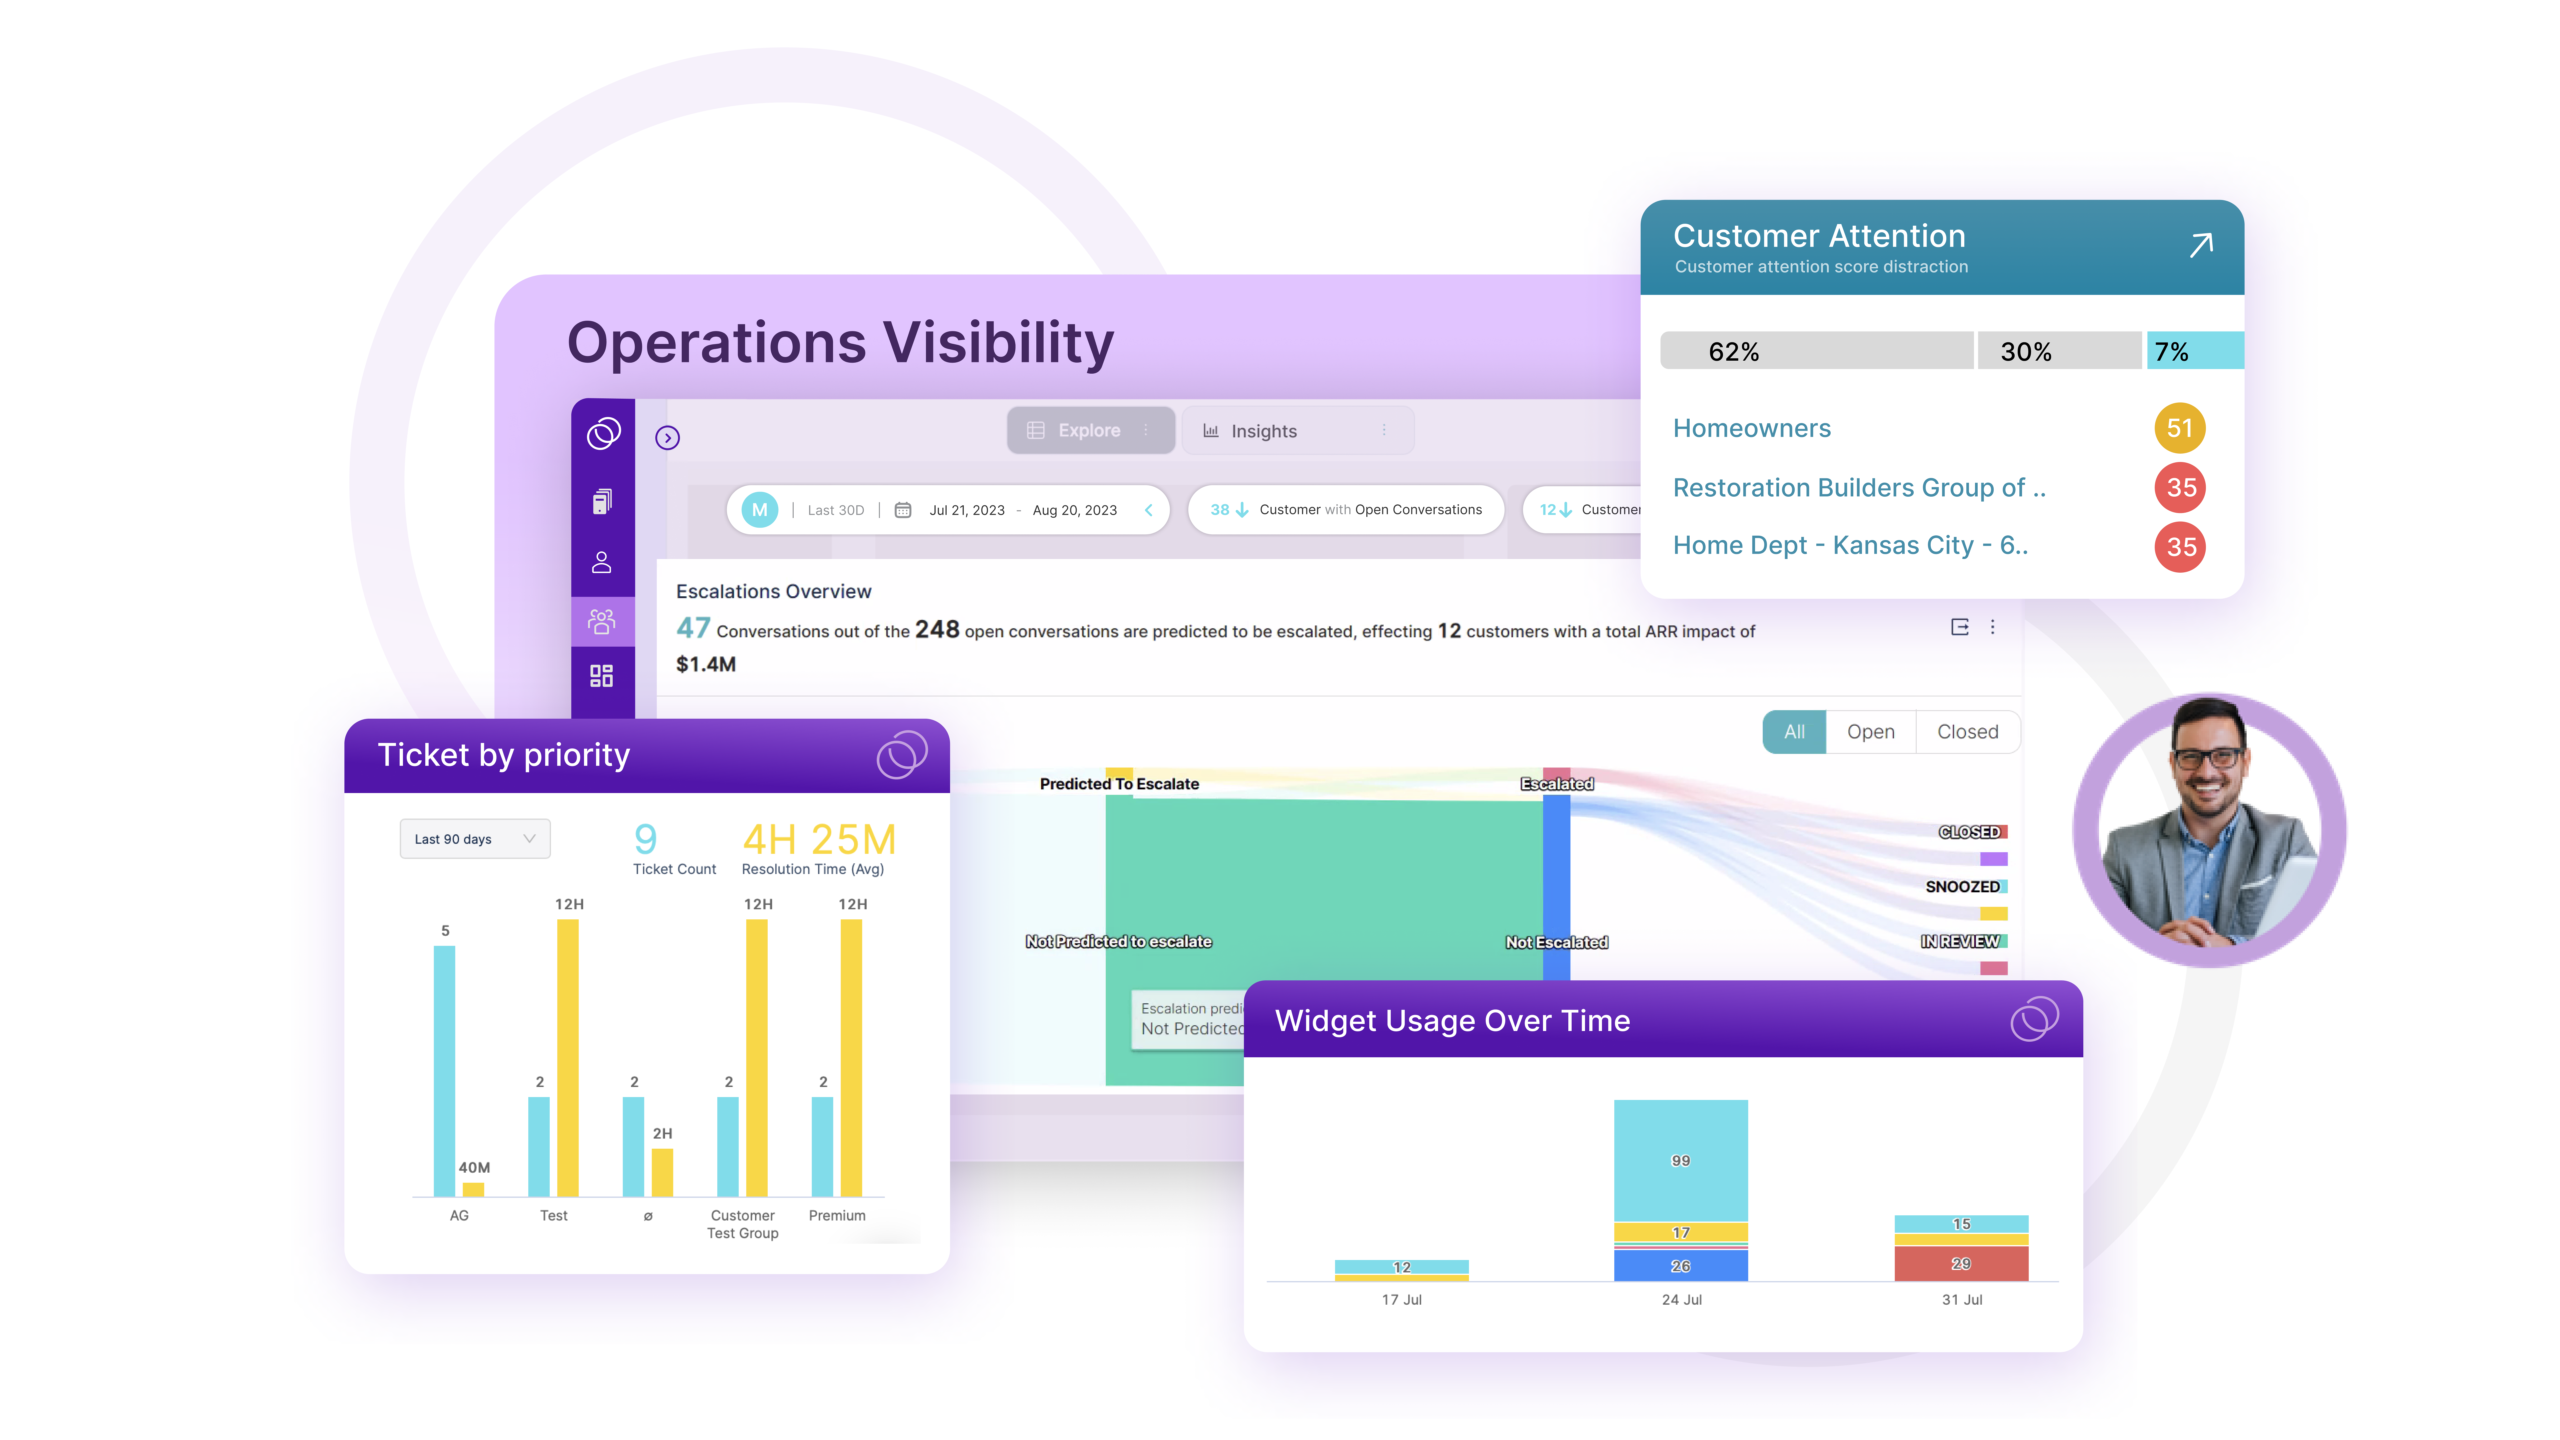
Pull Reports In Minutes Not Days
TheLoops UI and realtime reporting framework removes the need for a data engineer. Drag and drop functionality lets you build quickly and easily with data from any system you’ve integrated.
Analytics, Alerts And More!
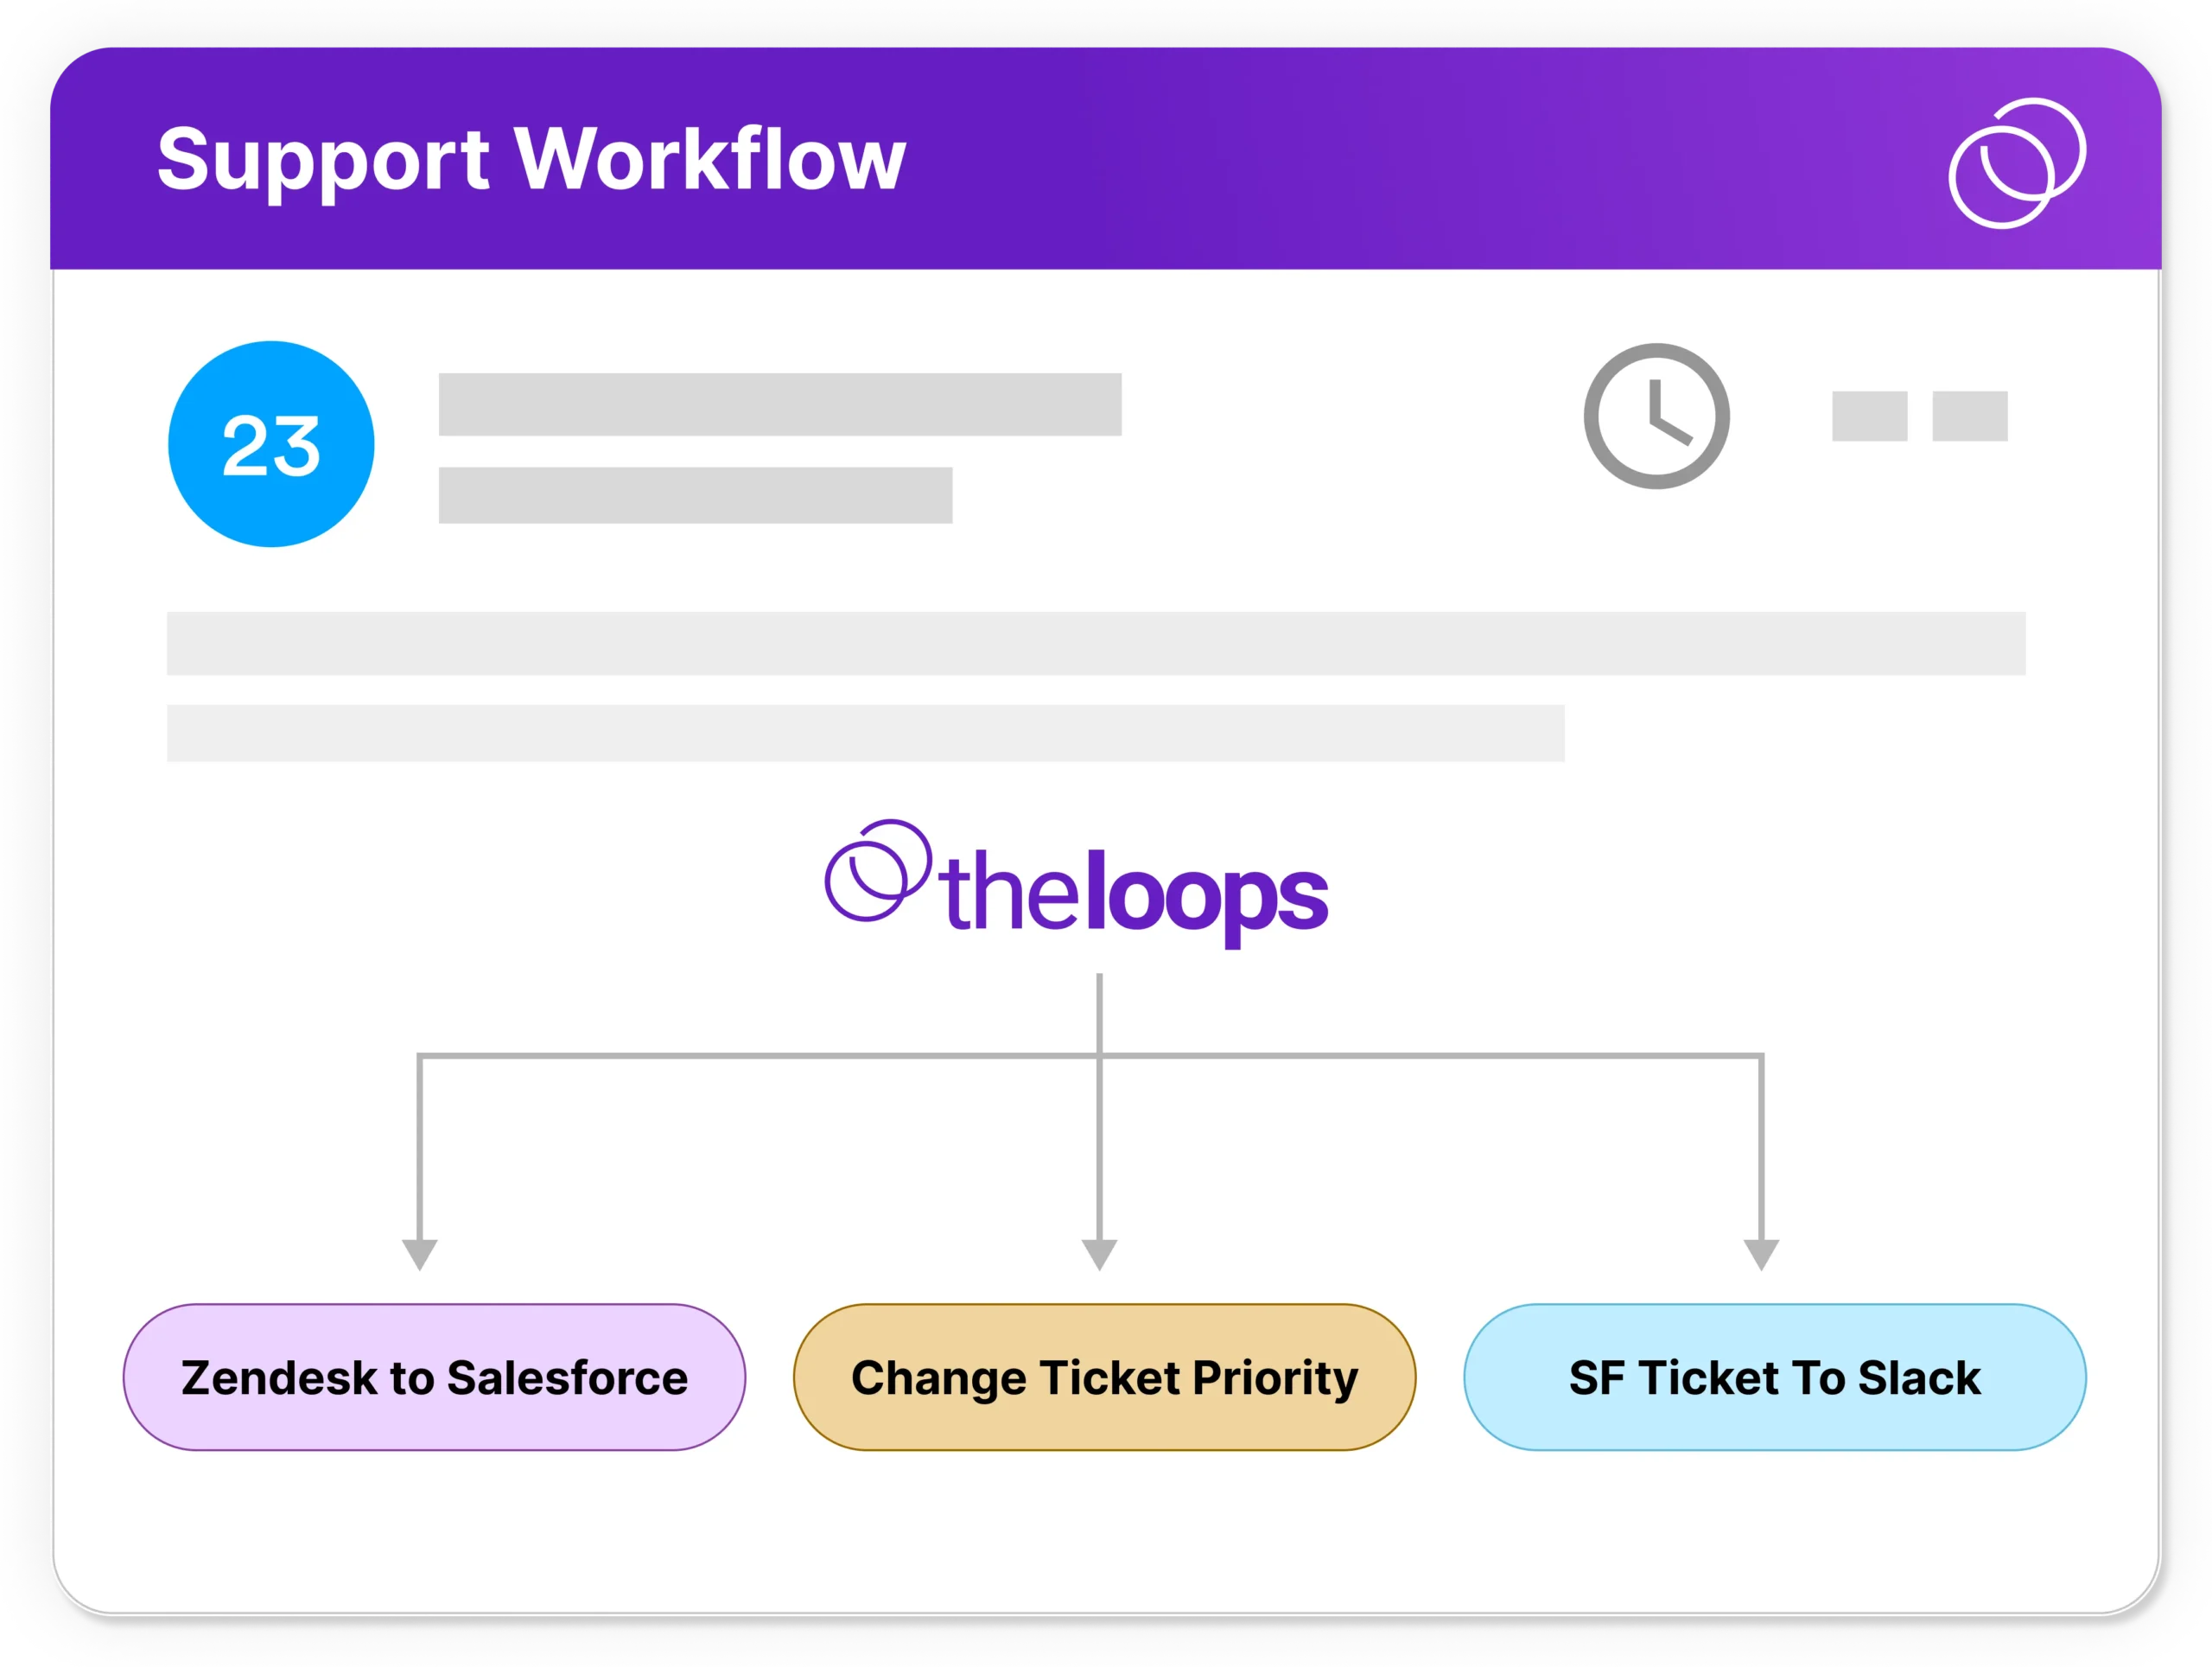
Boost Efficiency With Workflows
Build customizable workflows with cross-platform automations that are helpful in saving your team time. Available for support, backlog, escalation and feature creation to start.
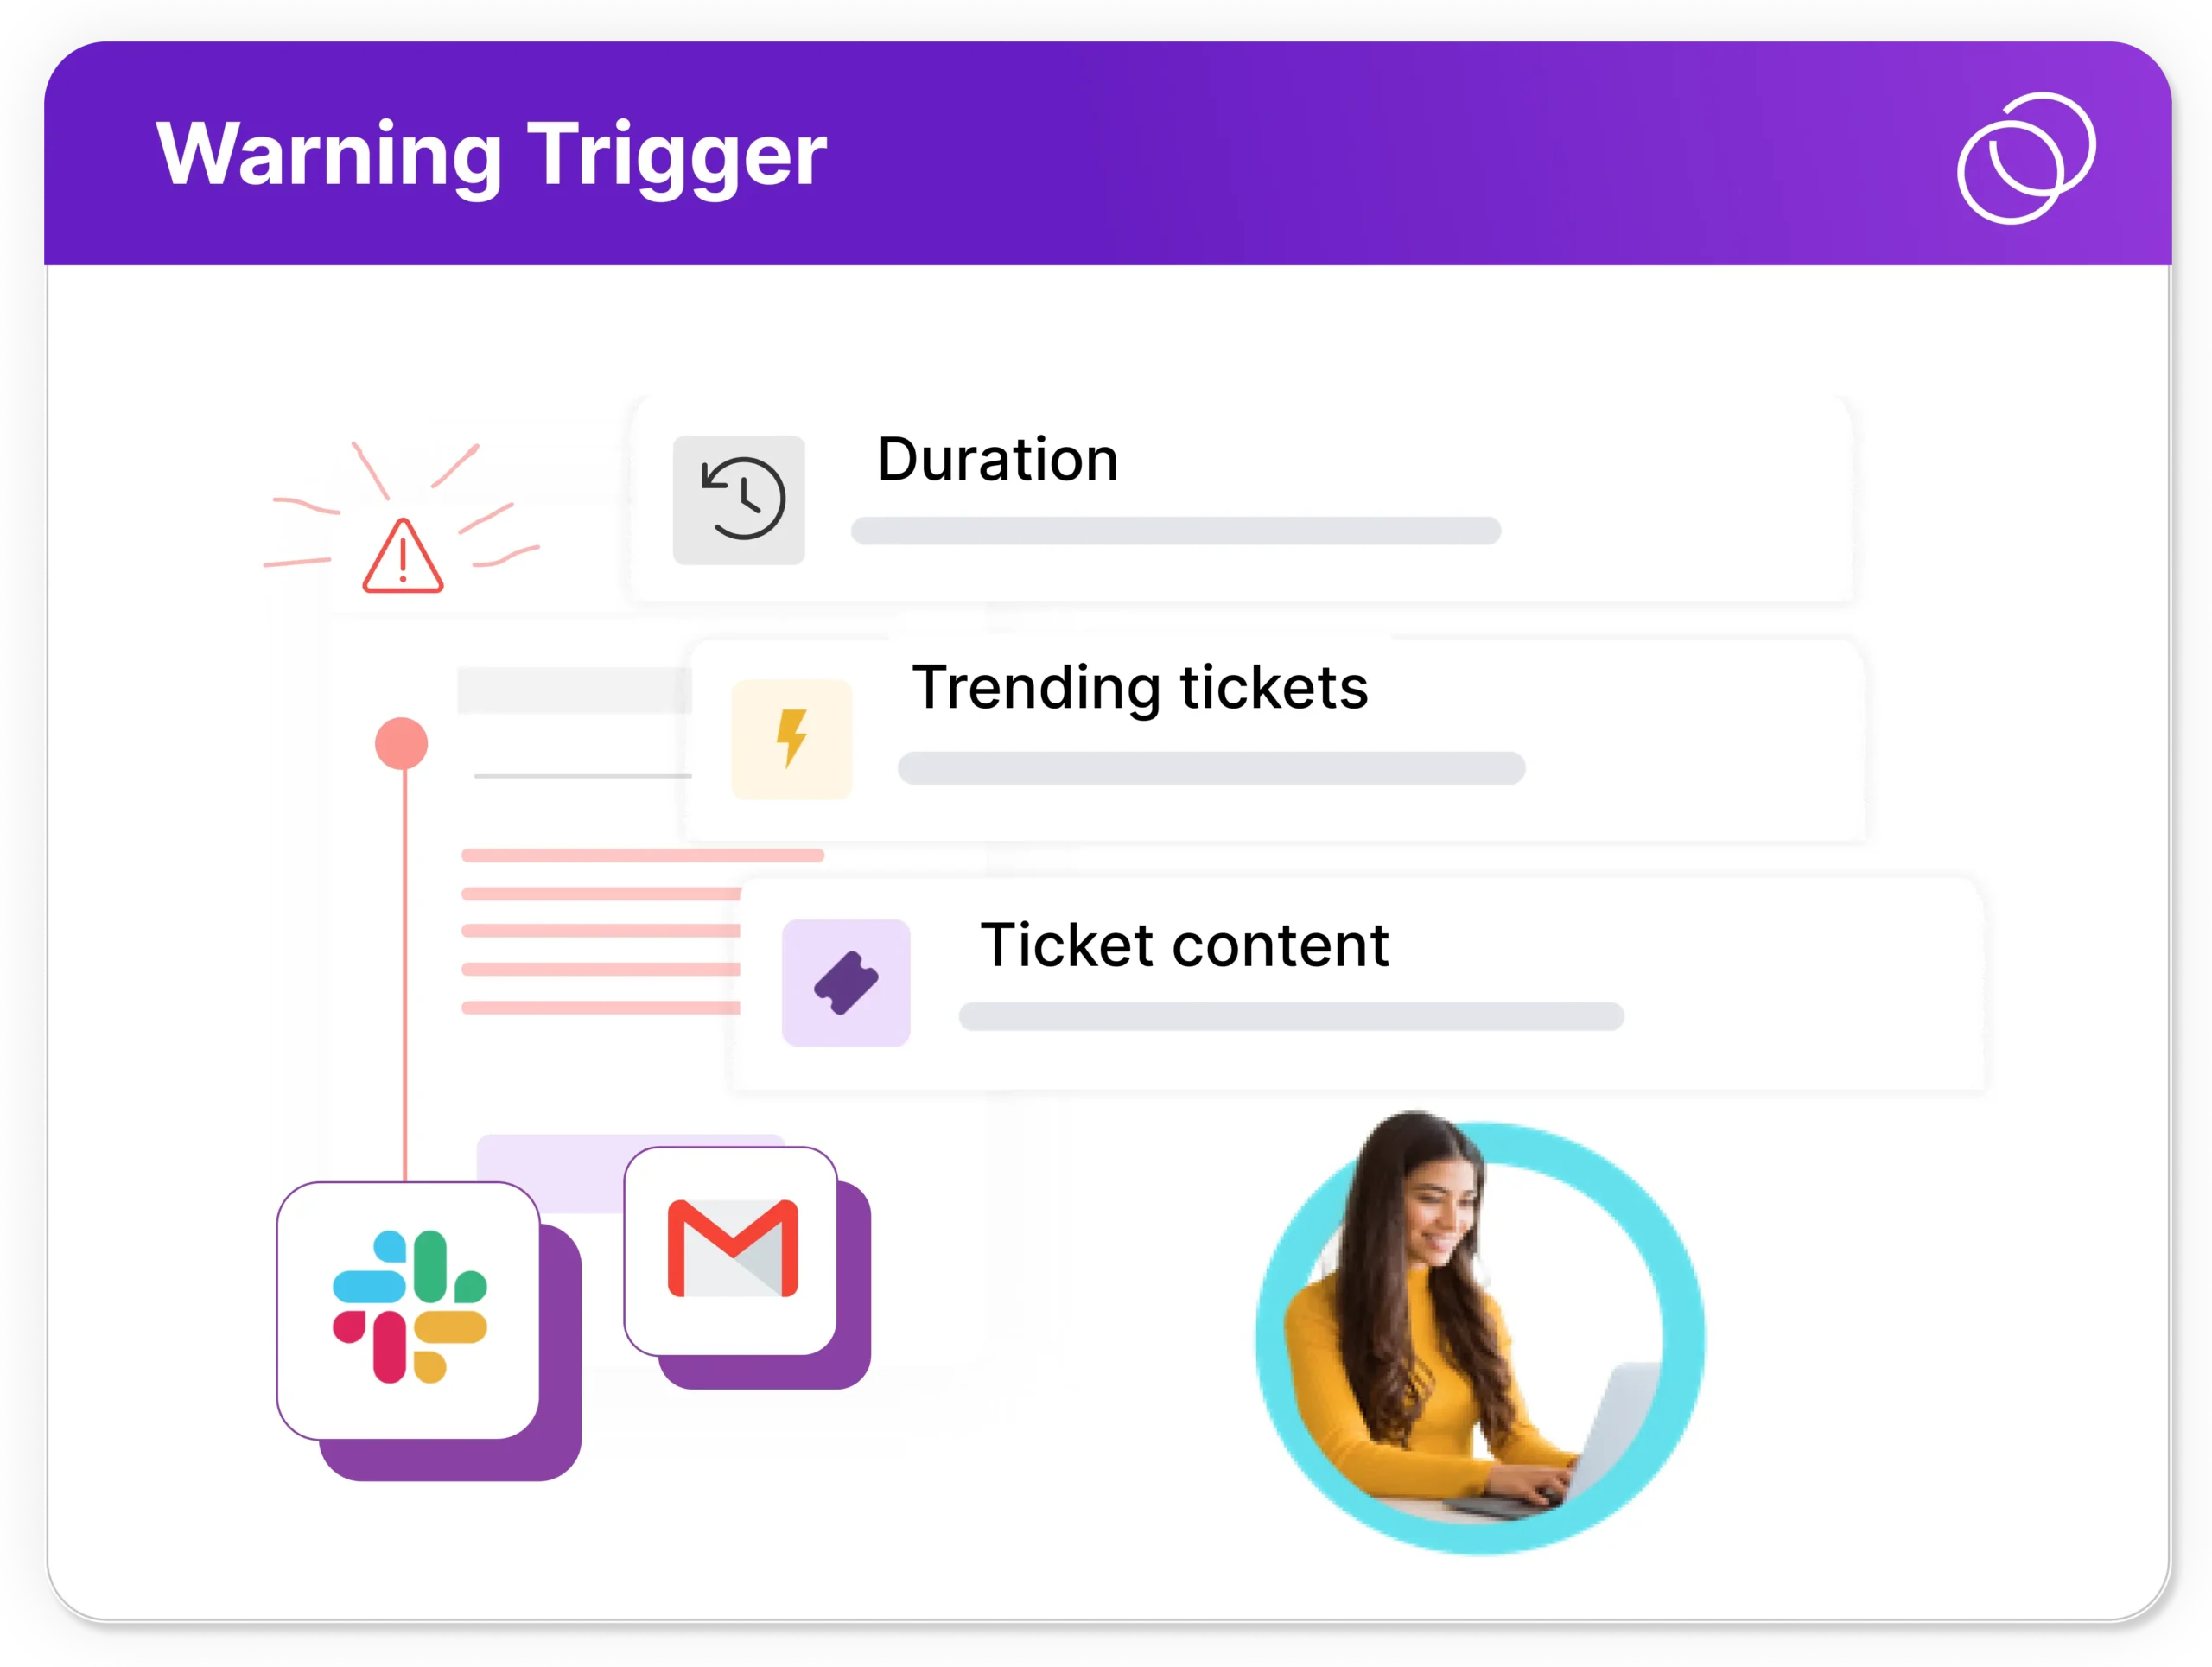
Be Proactive With Early Warning Triggers
Out of the box alerts for email and Slack deliver critical information such as SLA breaches. Within TheLoops Platform, alerts direct your attention to anomalies and trends.
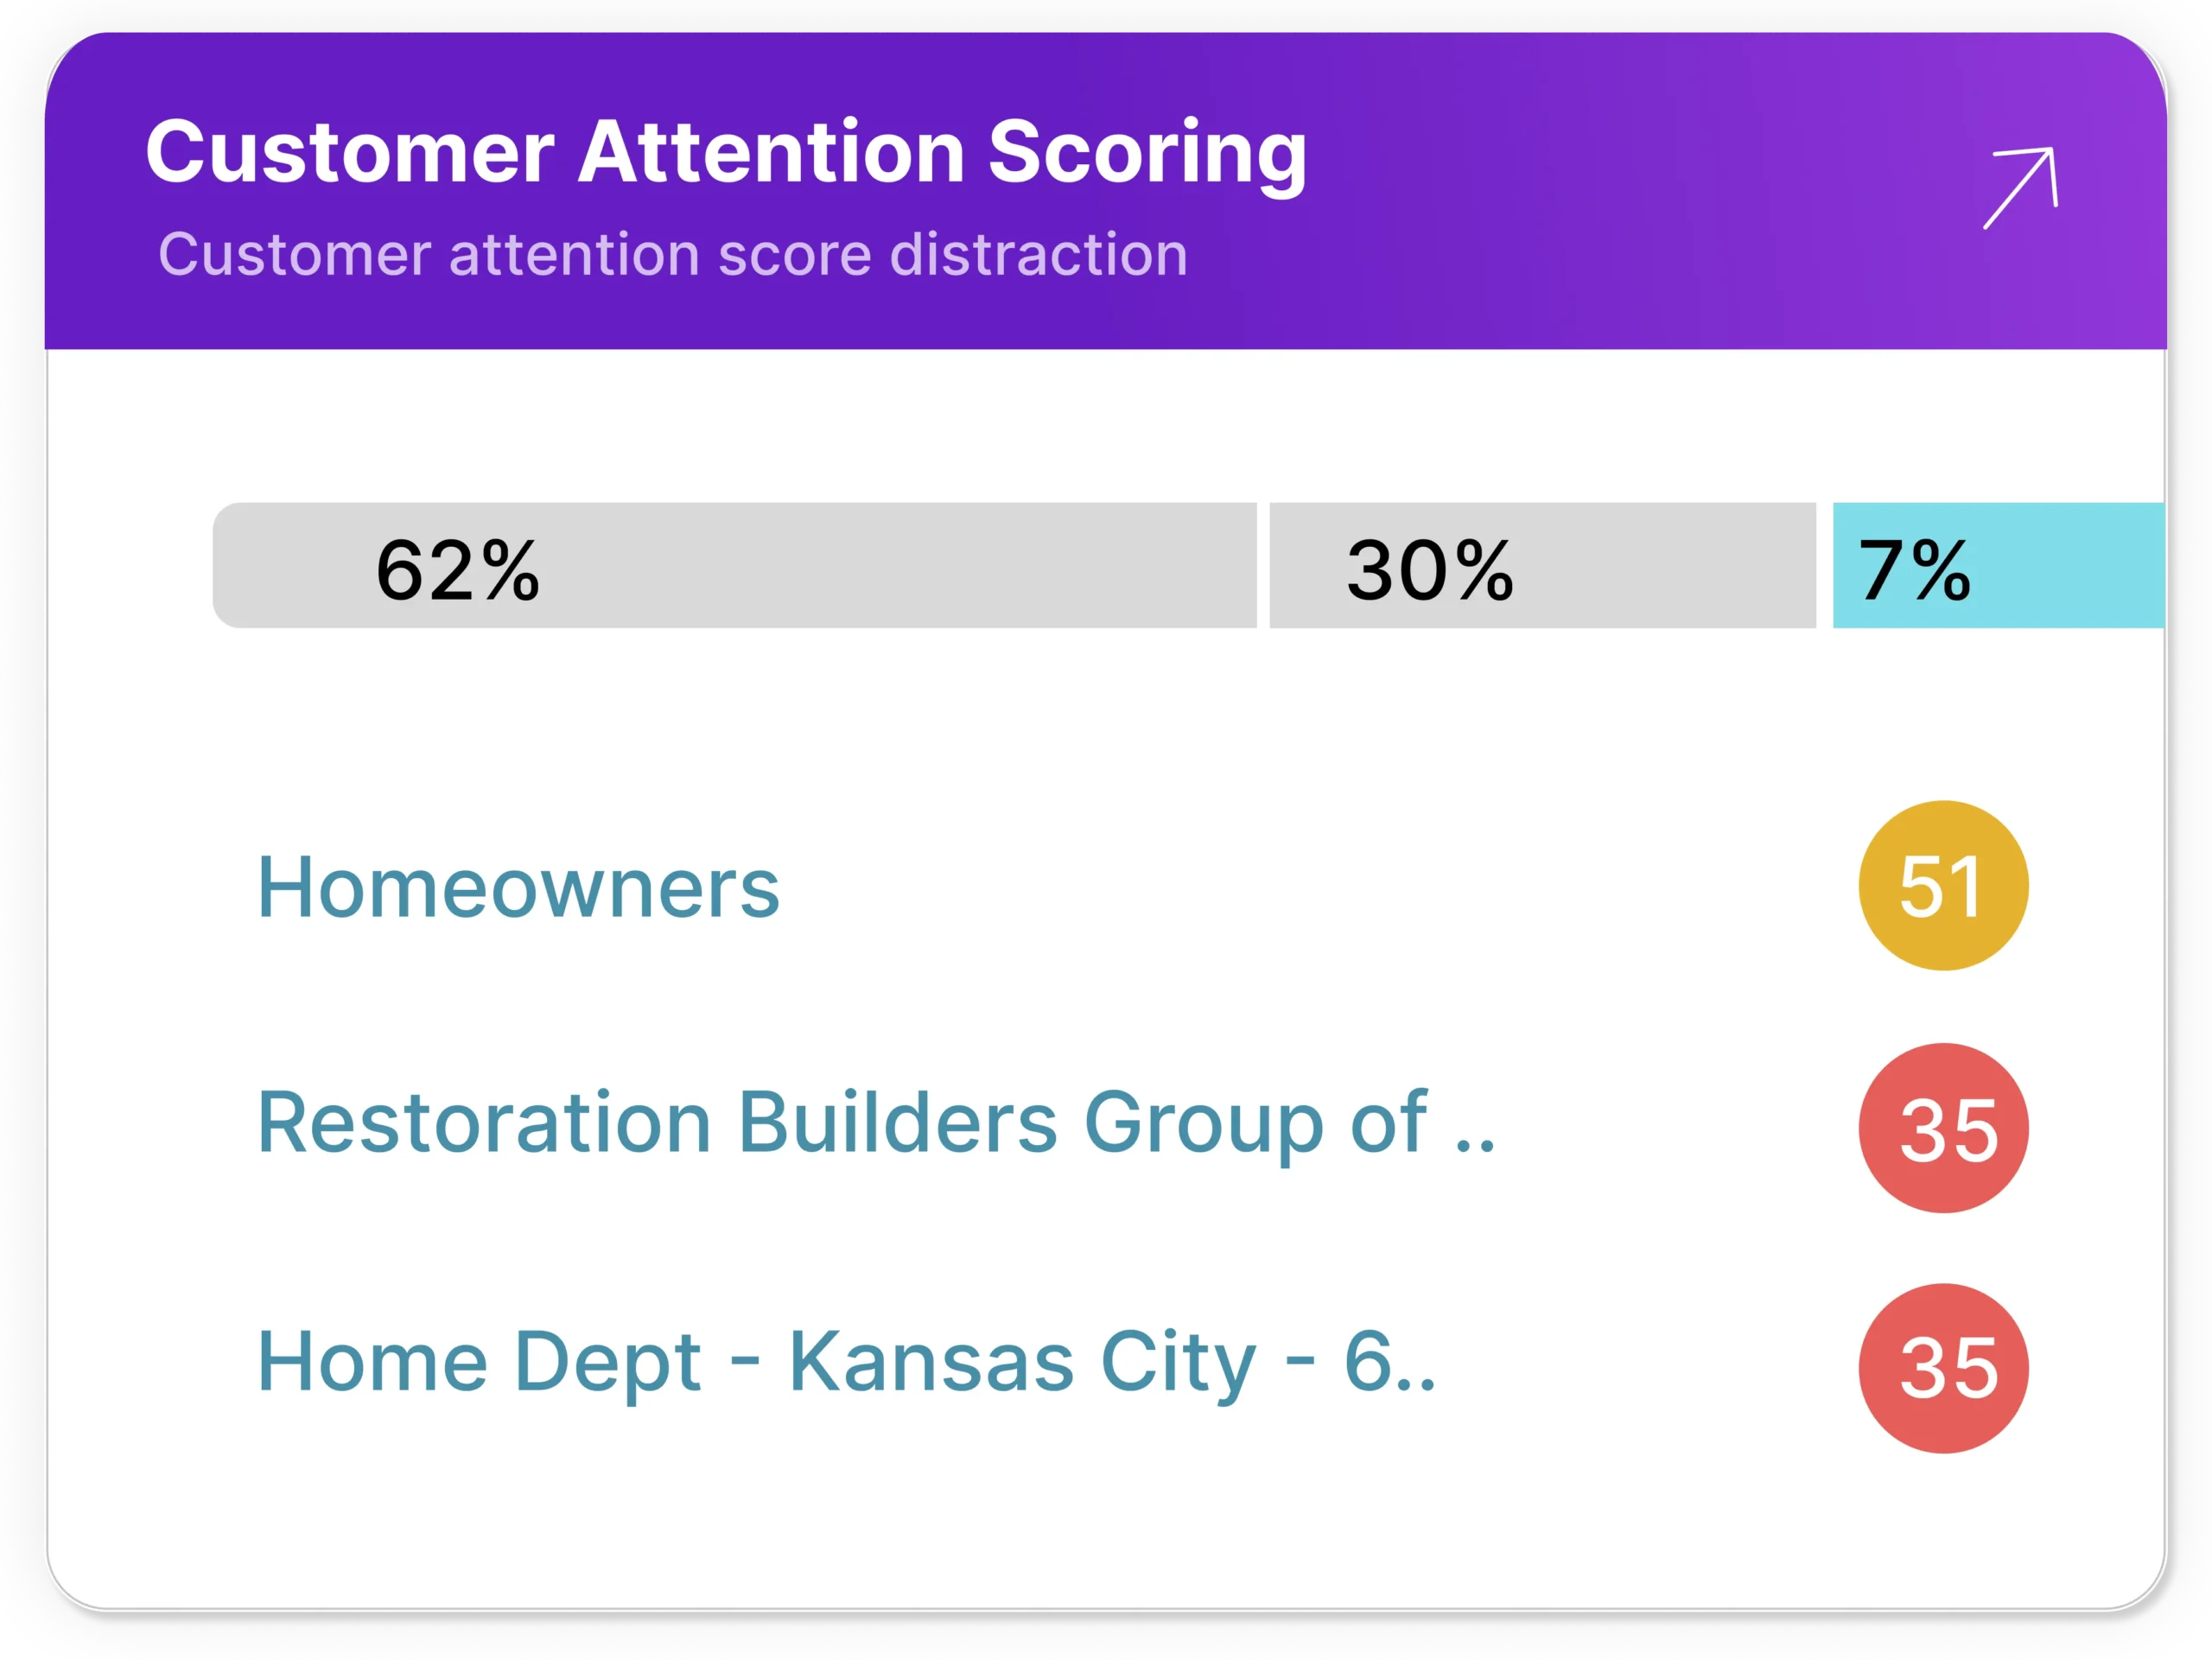
Understand Cases Better With Scores
Risk score, Attention Score, Impact score–these are just a few of the scores generated by TheLoops AI. Scores are also automated and based on dynamic attributes.
Resources for Topic Trend Analysis

27%
Productivity Gain
“Partnering with my peers involves using data to support their goals. Thanks to TheLoops, we’re able to extract data very efficiently and accurately, with minimal guessing. This clarity makes it much easier to take actionable steps aligned with other teams and adjust the roadmap with confidence, knowing that the changes will make a real difference.”
Genady Rashkovan
VP of Global Support


