Customer experience has dominated conversations for the last few years in the technology industry. A primary driver for this has been the shift from customers being locked into long-term relationships with hardware and software vendors in the on-premise world, to subscription XaaS products which allow customers to easily move to a different provider at the end of the subscription. This has raised the stakes on delivering an exceptional customer experience. Eliminating any friction that may give a customer reason to churn is now key.
With a focus on ultimately driving renewal rates and account growth, there are a number of interrelated trends connected to customer experience, which is fueling technology spending and forcing companies to transform many aspects of their business:
- Customer Success: The advent of the customer success organization began a decade ago, with companies introducing this new organization tasked with onboarding customers to accelerate adoption and value, ensuring high renewal rates.
- Chief Customer Officer: The CCO role has become popular within B2B tech firms as the central figure who owns, or at least influences, the end-to-end customer experience.
- Product-Led Growth: Product-led growthcompanies design products that are easy to adopt, use, and receive value from, and we often see PLG companies introducing freemium products, showcasing the product itself to drive revenue instead of the traditional account executive model selling to executives. 55% of TSIA members currently offer a freemium model.
As a result, 57% of companies, according to TSIA’s Customer Success Benchmark, have executed a customer journey mapping exercise, to better understand the end-to-end customer experience, and identify friction points that ultimately impact adoption, retention, and expansion. However, the focus of these initial journey mapping exercises has been mapping the processes, the data required, and applications used. While streamlining the experience—for both employees and customers—is critical, it is not enough. The next sections will discuss approaches required to mine the customer experience to identify actionable insights, how to put these insights into effect, and recommended starting points.
Actionable Insights: Correlating Data, Activities, and Outcomes
Oceans of data, siloed departments and systems, lack of integration.
- Qualitative Data: This is data related to the quality of the customer experience, such as customer satisfaction( CSAT), customer effort scores (CES), and Net Promoter Scores (NPS), , gathered at various points of the journey. Typically these metrics are collected for individual or department goals, and not analyzed in a broader context.
- Quantitative Data: This is information about activities and interactions, i.e., product adoption/consumption details by account and user, onboarding activities, support cases, escalations, bug and enhancement requests, etc. This information can help understand typical engagement patterns, and identify accounts which are highly engaged, or less engaged.
- Outcome Data: This is information related to the value customers are receiving from technology investments,, i.e., renewal rates, expansion rate, metric improvements, return on investment (ROI), etc. Currently only 19% of customer success teams have a customer benchmarking program to track improvements to cost, quality, and financial metrics due to adoption of technology.
Companies must do more when analyzing the customer journey than just better define the process and data flow from prospect, to customer, to renewal. They need to understand the impact of every activity and experience along the journey, and how these events impact business outcomes—for both the customer and the technology provider. This requires correlation analysis of positive variables (high CSAT scores, fast case resolution, self-service success, proactive issue remediation), negative variables (outages, escalations, reopen rates), and activities (number of cases, features or flows used in applications), and how each of these ultimately influences renewals, expand selling, and overall long term profitability of the account.
There are a number of challenges which have prevented most companies from this level of analysis. The huge amounts of data, and the fact that it is stored in so many siloed systems, creates a great deal of complexity to correlate data in disjointed systems and formats. Add to this that few companies have the data science resources available to tackle such a sophisticated project.
Innovative technology is now available to enable sophisticated correlation between disparate data sets, leveraging virtual data lakes, which can access needed information without read/write integration, low code/no code UI for users to eliminate complexity, and results within hours, not months. An example of a vendor offering these capabilities is TSIA Partner, TheLoops, who has showcased customer success stories in multiple TSIA webinars and conference presentations.
Putting Insights into Action: CX Ops
Each department has an operations (or ops) group, and historically they have been fairly tactical, identifying processes, tools, and best practices to boost the effectiveness and productivity of employees in sales, professional services, technical support, and development. But these ops groups are growing ever more strategic, a good example being customer success operations, which is immersed in the science of customer success, and creating sophisticated health scores based on multiple pieces of data and weights.
But just as the CCO’s role is either owning or influencing the entire customer journey, an operations group is also necessary to evaluate the findings of journey analysis and correlations, and begin architecting the ultimate end-to-end experience. Whether this is a committee of participants from each department’s ops group, or a separate overarching ops group reporting to the CCO, chief information officer (CIO), or chief revenue officer (CRO), companies need to begin looking at customer experience operations from a macro-level, holistic view, and prioritize changes to people, process, and technology that correlation analysis shows has the biggest impact to long term account revenue and profitability.
This group can also be tasked with identifying gaps and inconsistencies in data. As an example, a single company may be tracking satisfaction with different scales, making it difficult to normalize, and not collecting any data for some critical steps of the journey: Example, according to TSIA’s professional services benchmark, PS teams are only collecting satisfaction ratings for 26% of completed projects. A cross-enterprise view with a CX Ops group will identify these gaps and work with individual departments to boost data capture for strong journey analysis and correlation.
The Logical Place to Start: Technical Support
Every step of the customer journey has implications for renewal. But a logical place to start doing correlation analysis on data, events, and activities and how they impact annual recurring revenue (ARR) is technical support. TSIA data has shown that the relationship between customer satisfaction with assisted support and renewal rates is so strong that it has a p-value of 0.001, which means that there is less than a 1 in 1000 chance that this relationship does not hold. As Vele Galovski, TSIA vice president of research for support and field services, said in his research report, “The Evolution of the Support Services Business Model.” “The better that Support organizations handle an incident, the higher contract renewal rates.”
Whether your company has done this correlation or not, we all understand that satisfaction with support has a significant impact on the customer experience. And, due to the sheer volume of support assisted and unassisted interactions, you typically have much more data to work with for each customer from support incidents than any other department in the company.
Chart 1: Average Monthly Support Incident Volumes
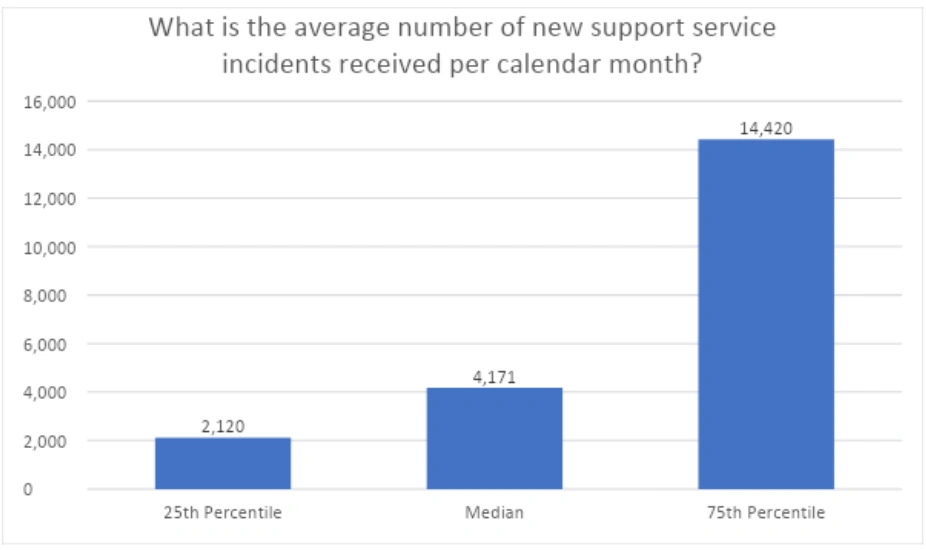
Source: TSIA 2022 Support Services Benchmark
As seen in Chart 1, TSIA members receive thousands of new support incidents per month. Even smaller companies, at the 25th percentile of the benchmark survey for this metric, receive over 2,000. Companies at the higher end receive 14,000+. And each of these incidents has a wealth of metadata associated, such as response time, resolution time, number of interactions, sentiment analysis of case notes and email/chat conversations, escalations, and more.
By understanding which support metrics have the greatest impact on customer success, support management is able to create a roadmap to target improvements that will have the biggest return. The same technology that can correlate support metrics to revenue can also be used to identify indicators, or signals, that influence these metrics.
As an example, in a TSIA webinar presented earlier this year, “Contextualizing Data to Drive Personalized Support,” technology firm Upstart had a goal of personalizing the support experience, and reducing issue resolution time and escalations, which were having negative impacts on accounts.
Using TheLoops to correlate support and product data, Upstart saw the average handle time of support incidents cut in half, a 53% improvement in time to discover the root cause of issues, and a 50% reduction of escalations to engineers.
Final Recommendations
- Who is driving customer journey mapping? TSIA is seeing customer success groups, or a chief customer officer, leading this exercise. For support leaders, if you haven’t been invited to be a part of this project, find out who the owner is and request to be included. For those involved in journey mapping, push to expand the scope beyond process and data to include correlating data and activity to outcomes.
- Consider a CX Ops team. Though few companies have the concept of an enterprise CX Ops team today, it is worth discussing with the executive who owns customer journey mapping. This can be a cross-functional group of existing departmental ops experts, or longer term, a separate entity aligned with the CCO or other C-level exec.
- Create an outcome-based roadmap. Projects to eliminate friction points in the customer experience should be prioritized and funded based on impact to customer and revenue outcomes, not departmental lobbying power. For support leaders, having the data to show the correlation between the support experience and revenue is key to ensuring visibility, influence, and budget.